How to Track Costs in Multi-Tenant Kubernetes Clusters
Many companies opt to run workloads of different teams or products in shared Kubernetes clusters. This brings an interesting challenge in terms of cost analysis.
Knowing how much clusters cost is trivial, but might not be enough. If you need to drill down to the team or product level, you will have to look for tools that can help you with that.
Kubernetes Resource Report, created by Henning Jacobs, is one of those tools that I have been exploring lately, and I think it deserves to be shared.
Running as Docker Container#
Kubernetes Resource Report is written in Python and can be run as a module against clusters. Even so, my first attempt was with the official Docker container:
kubectl proxy --accept-hosts '.*' # start proxy to your cluster (e.g. Minikube)
# run kube-resource-report and generate static HTML to ./output
docker run --rm -it -e CLUSTERS=http://docker.for.mac.localhost:8001 --user=$(id -u) -v $(pwd)/output:/output hjacobs/kube-resource-report:21.2.1 /output
Instructions for macOS. Other instructions can be found in the project’s README.
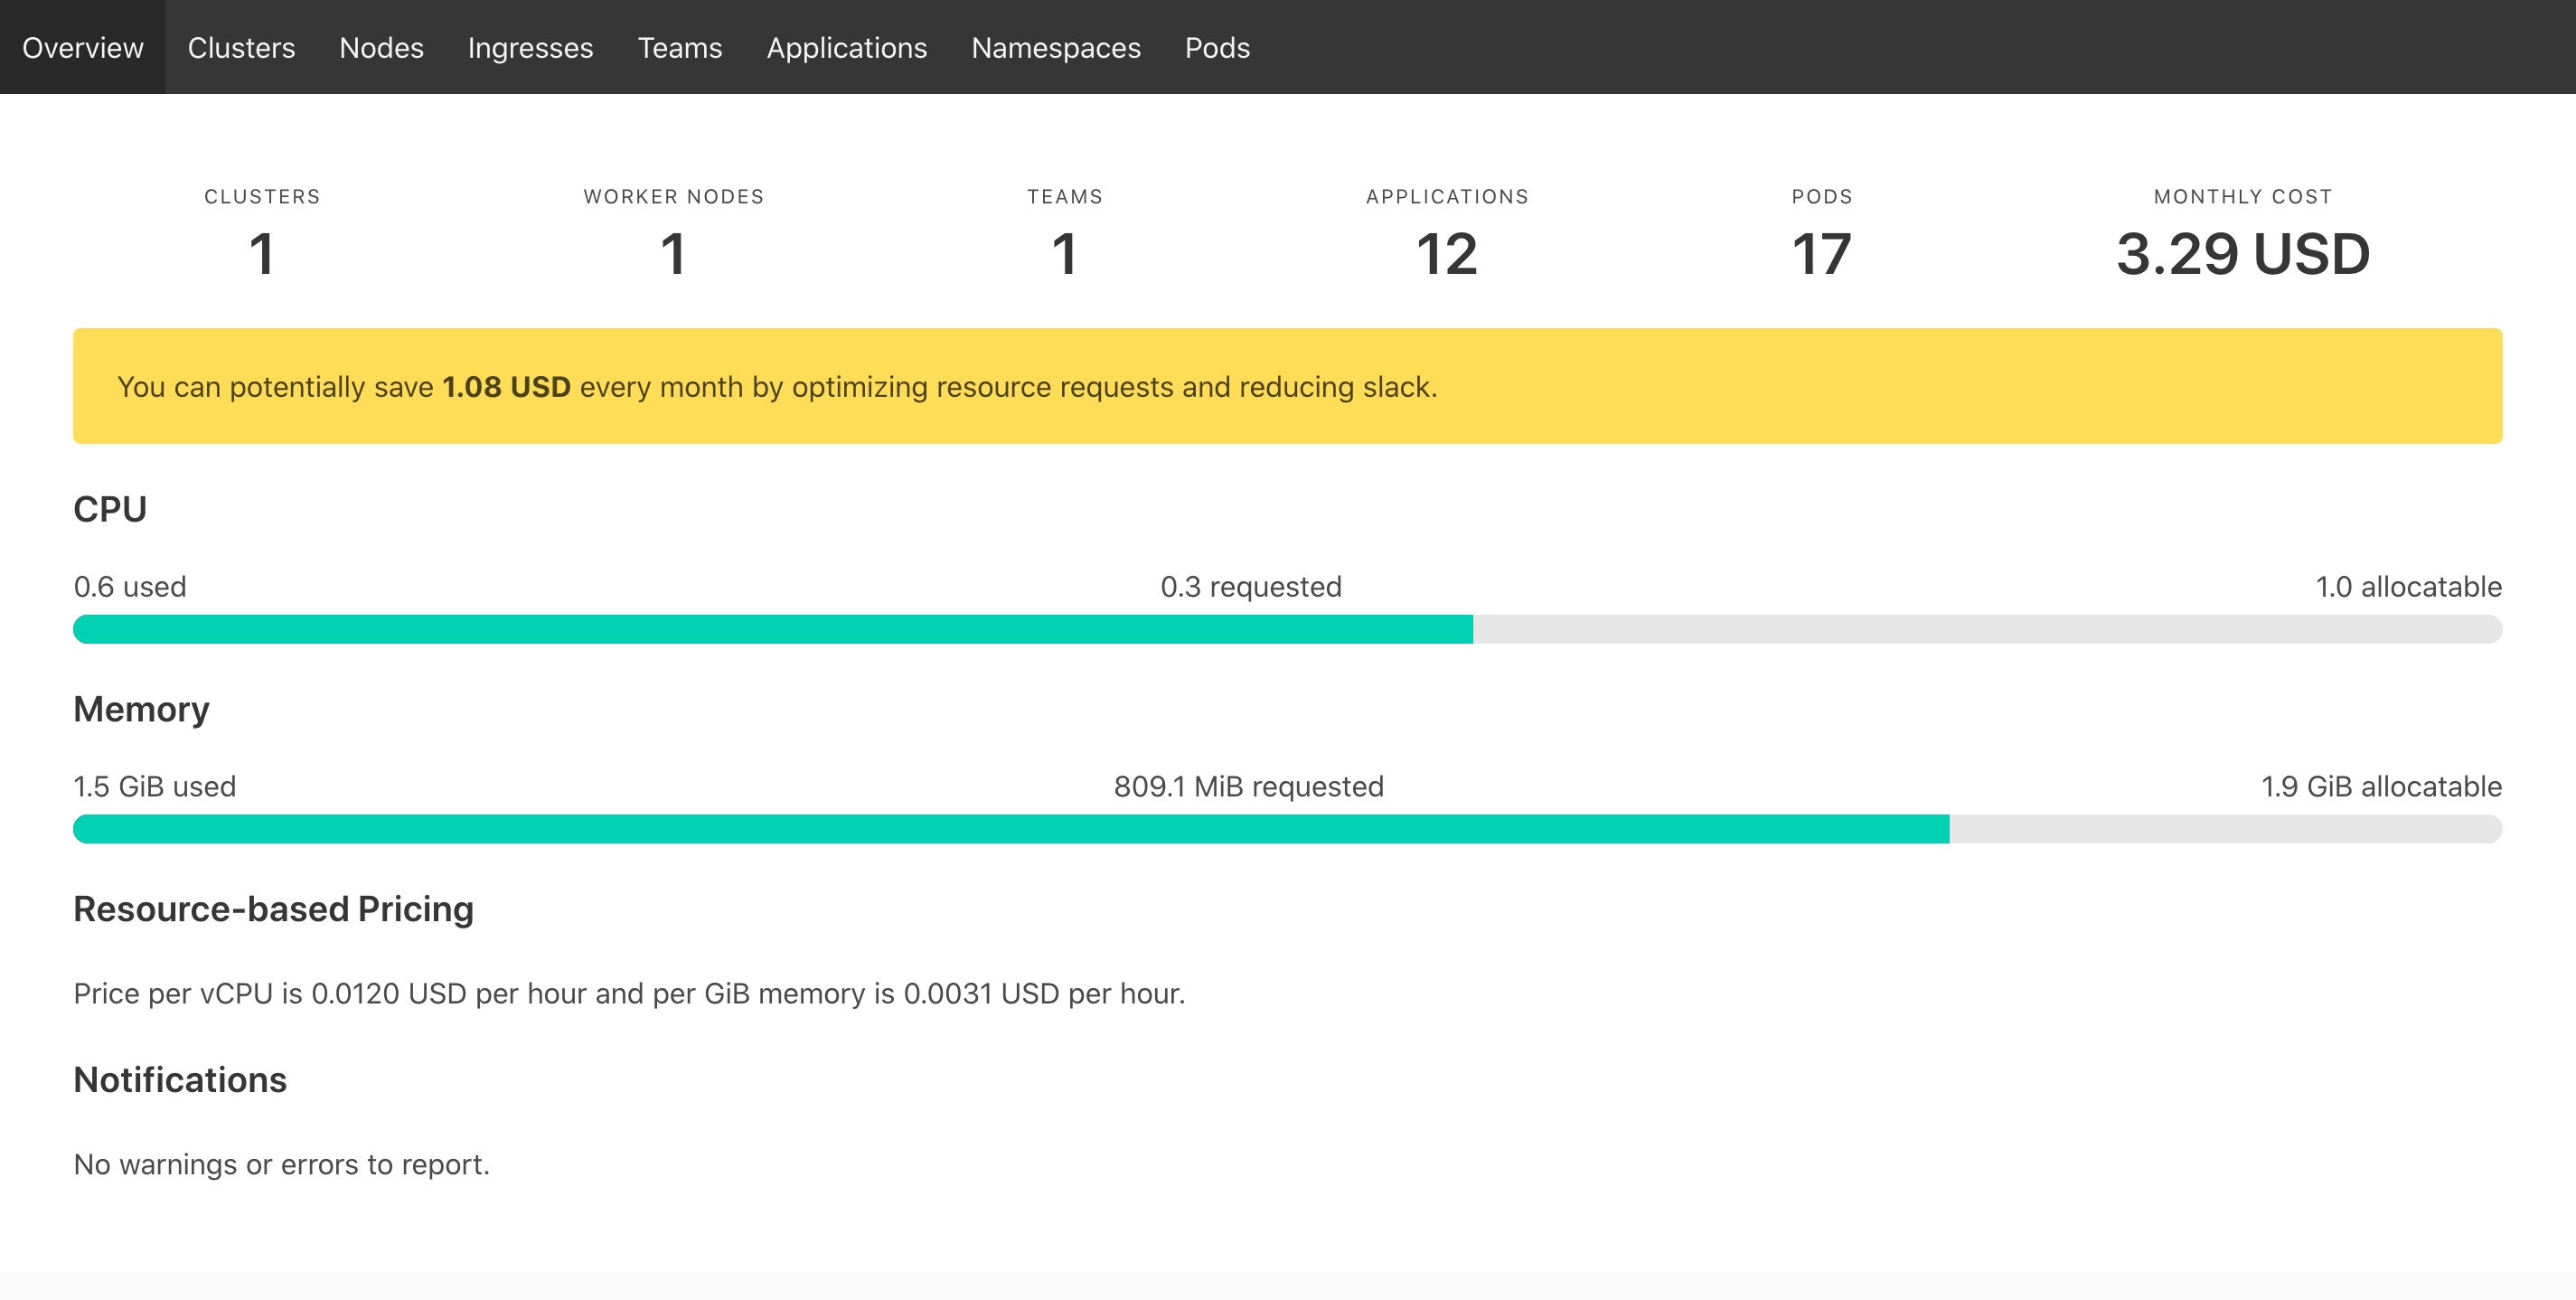
After a few minutes, depending on the clusters' size, the container stops and you can find the results in the /output folder. You will have both .tsv files and static assets. Open the index.html file in a browser and explore the UI.
Congratulations, you have generated the first snapshot of costs.
Deploying to a Cluster#
If you want to have reports available any time without needing to generate them manually, you can deploy Kubernetes Resource Report in a cluster.
kubectl apply -k deploy/
kubectl port-forward service/kube-resource-report 8080:80
You can now open http://localhost:8080/ in your browser. By default, the script will run and generate a report every minute, but you can change that and other behaviours in the deployment.yaml file.
There is a Helm Chart that is not officially supported nor tested if you prefer.
If you want to use OAuth authentication and expose the UI to the internet, I recommend this tutorial.
Results#
You can take a look at a live demo.
One important metric that the UI shows is the “slack” cost. That metric helps you to identify potential savings.
Slack is the difference between the requested resources and the real usage. – Henning Jacobs1
By selecting the Slack Cost column header you can order applications or namespaces. If you do it in descending order, you can see some opportunities where resource requests can be lowered.
But keep in mind: these are snapshots in time and do not necessarily represent peak hours, for example. You need to look at usage over time for better tuning.
Caveats#
At the top of the project’s README it’s clear that:
This version only supports node costs for AWS EC2 (all regions, On Demand, Linux) and GKE/GCP machine types (all regions, On Demand, without sustained discount)
If you want to ingest the actual costs instead of on-demand pricing, you will need extra development. For example, with AWS it would make sense to integrate the tool with CUR.
Furthermore, the cost per application only takes into account the cost of instances. It does not take into account data transfer nor storage attached to instances, for example.
Final Remarks#
Kubernetes Resource Report is a great tool to quickly get a sense of costs, by correlating the resource requests and the price of each node in the cluster.
I’m also looking forward to exploring the Prometheus-style metrics endpoint that a recent commit introduced to visualize costs evolution along the time.